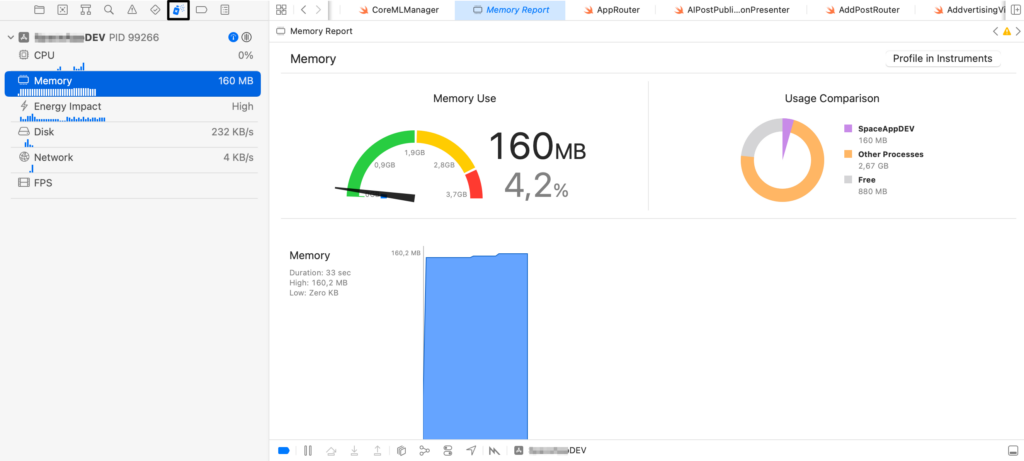
Section 1: Memory Report
Each time running the app from Xcode and testing – review the Memory Graph, and validate if there will appear some unexpected memory consumption increase. Try to minimise the memory consumption, and avoid memory leaks.
Section 2: Memory Graph
Make sure that you have 2 targets configured in Xcode. If not – configure Prod and Dev targets. To be able to test the Prod builds – with configurations more close to production one. For Dev Target verify that the Profiling is enabled.
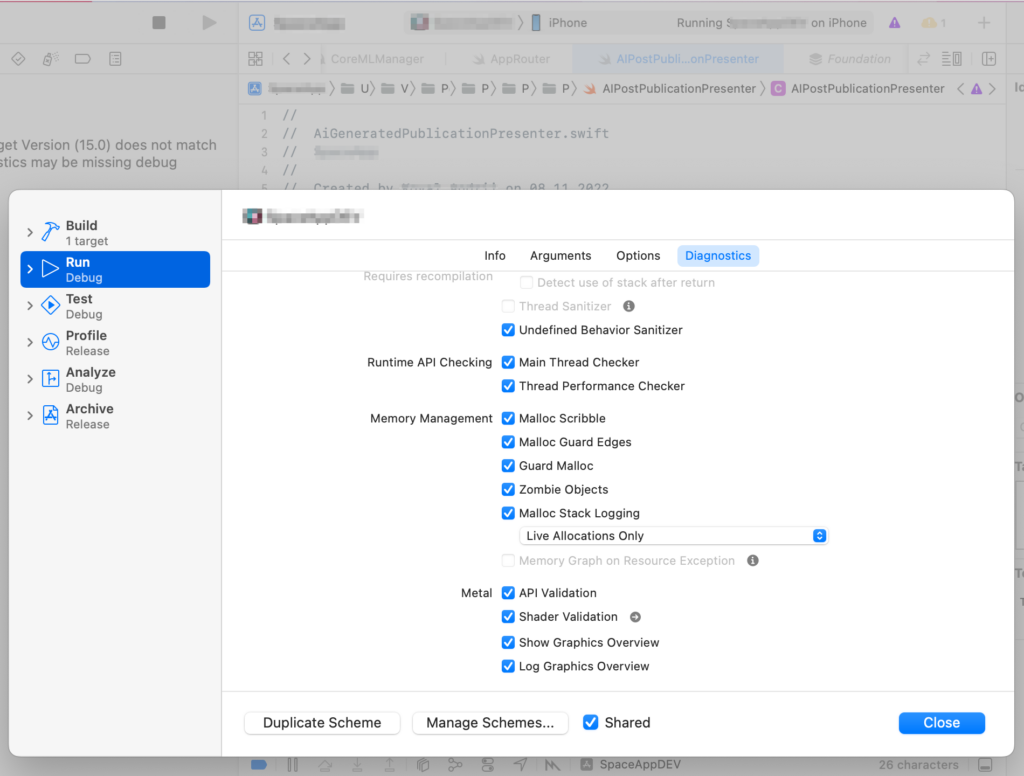
After that in Diagnostics tab verify that the Malloc Stack Logging is set to Live Allocations Only.
Now run the app. And click the Memory Graph debugger.

Filter out the Objects you are interested in. Look through them – figure out which related object is holding the strong reference.
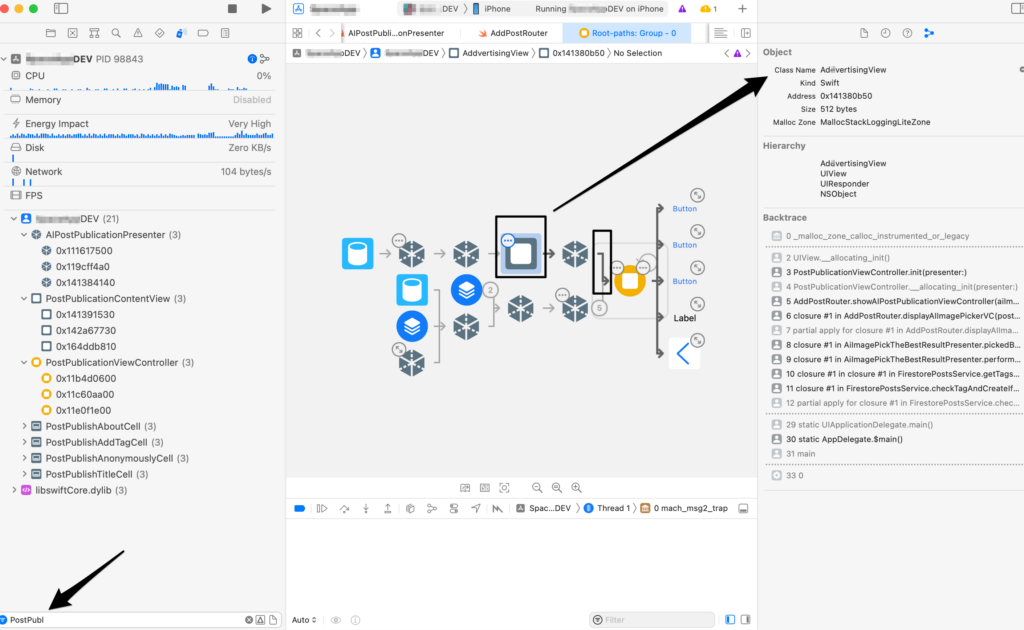
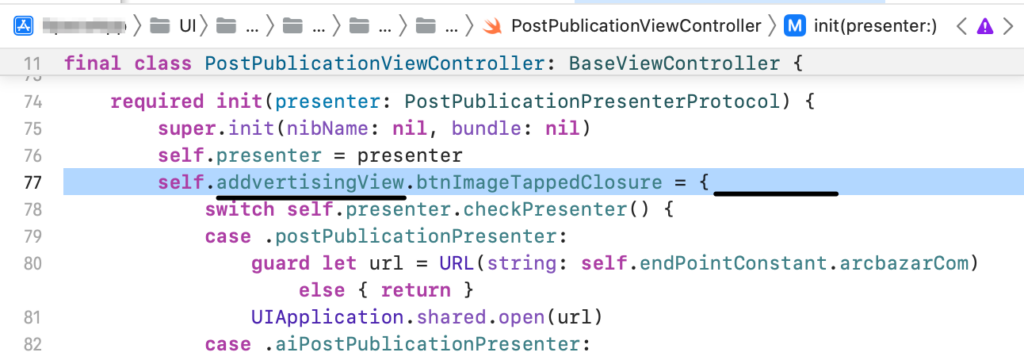
Now carefully review the related code. In our example the “self” was strongly captured in a closure of a subview callback.